Summary
I recently investigated an issue which manifested as a TCP timeout between a server and a client but the root cause turned out to be a completely unrelated container. The whole debugging process was very fun and worth noting down.
Background
There is a gRPC service S that supports both TCP and TLS connections. This service consists multiple instances running behind an AWS Classic Load Balancer (CLB).
The clients of S runs on all EC2 instances and periodically talks to S via TLS.
One day, we found that on one instance, client C could not talk to S. The
connection timed out with an error message like transport: authentication
handshake failed: write tcp 100.1.2.3:63434->100.4.5.6:7001: i/o timeout where
100.1.2.3 is the client IP and 100.4.5.6 is the server CLB IP.
The first time it happned, since it only happened on one of thousands of instances, we simply decommissioned the bad instance. However, the same issue happened again in a couple of days on another instance.
When the issue happened, I was able to reproduce it by running grpcurl -key
web.key -cert web.crt 100.4.5.6:7001 list, which makes an SSL connection to
the gRPC server. However, curl 100.4.5.6:7001, which makes a TCP connection,
was all fine.
In the following sections, I’m going to talk about the suspects we had and how we ruled them out one by one and eventually caught the real culprit.
Suspect #0 - Service S
Naturally, the service S was the first to suspect becuase we had seen some timeout issues in the past when the service is overloaded. However, this time it was a bit different. Because the error message indicated that the timeout happened during TLS handshake rather than during RPC request processing.
I tried calling service S from a good instance and everything looked fine. That proved the innocence of S.
Suspect #1 - Classic Load Balancer
Well, Classic Load Balancer, an old, to-be-deprecated system, surely sounds suspicious. However, we quickly ruled it out by trying to connect to a service S instance directly from the bad instance, bypassing the CLB, yet the problem still persisted.
Suspect #2 - MTU
In our settings, all EC2 instances use jumbo frames (9001 MTU). According to other experienced engineers on the team, the 9001 MTU had caused us trouble in the past. And the symptom of that issue was very similar to this one – TCP worked but not TLS. Therefore, MTU became our next suspect. Yet it also walked out clean when we found things didn’t improve even after we changed MTU on both client and server from 9001 to 1500.
Suspect #3 - Metatron (A credential management tool)
Metatron is a tool used to manage credentials on the instances. The certificates used in TLS connections are short-lived and renewed by Metatron periodically.
Honestly, Metatron was my biggest suspect at that moment because the error was “authentication handshake failed”.
We captured packets using tcpdump on the bad instance. It confirmed that the
timeout indeed happened during the TLS handshake. And we saw that the last
packet before the FIN packet was from the server to the client. That made me
suspect the Metatron-managed client certificate even more.
My suspicion only increased when I found the following error repeating in Metatron log:
time="2022-09-28T03:24:06Z" level=info msg="getInstanceCertificateV2 (1)"
time="2022-09-28T03:24:11Z" level=error msg="Got error from
nf-cloud-cert-distributor: Post
\"https://nfcloudcertdistributor.us-west-2.test.netflix.net:7004/REST/v1/internal/cert\":
context deadline exceeded (Client.Timeout exceeded while awaiting headers)"
Pretty fishy, huh? My theory at that moment was, Metatron failed to rotate the expired client certificate, causing the TLS handshake to fail. However, the next thing I did disproved the theory. I copied the client cert and key from another good instance and used them to make another gRPC request, yet it failed again. That made me realize that Metatron could have also been the victim of the same culprit rather than the culprit itself. In fact, I didn’t come to this conclusion that easily, partially because I was so biased and convinced that Metaron was the guy.
Wait, something else is not right …
The second time I tried tcpdump, I noticed something strange – It took a long
time (5+ seconds) after I ran the command and before “tcpdump: listening on
eth0” was printed. So, I ran a top command to find out if something on the
instance was using a lot of CPU. Interestingly, I found that the
systemd-journal process was taking 3000% CPU! By running “sudo journalctl -f”
command, I found the following interesting log right before an HTTP timeout
message:
kernel: TCP: out of memory -- consider tuning tcp_mem
A quick Google search took me to this
article,
which only suggested increasing the value. So I did. I doubled all 3 numbers of
tcp_mem kernel parameter:
$ sysctl net.ipv4.tcp_mem
net.ipv4.tcp_mem = 4588506 6118009 9177012

$ sudo sysctl -w net.ipv4.tcp_mem="9177012 12236018 18354024"
net.ipv4.tcp_mem = 9177012 12236018 18354024
Then magically, things started working! But I still wondered, why did the memory suddenly become insufficient?
Who sets tcp_mem in the first place?
One observation is that the tcp_mem value is different on different instance
types. An instance with a larger memory also has a larger tcp_mem value.
Digging deeper, I found that by default this value is set by the Linux kernel
using this
formula.
Also pasting the code here:
static void __init tcp_init_mem(void)
{
	unsigned long limit = nr_free_buffer_pages() / 16;

	limit = max(limit, 128UL);
	sysctl_tcp_mem[0] = limit / 4 * 3;		/* 4.68 % */
	sysctl_tcp_mem[1] = limit;			/* 6.25 % */
	sysctl_tcp_mem[2] = sysctl_tcp_mem[0] * 2;	/* 9.37 % */
}
So … Just Increase the tcp_mem Value?
I almost gave up and decided to just double the memory for instances all over the place. However, my curiosity was still killing me. I didn’t understand why the same values work on most of the instances but not that specific one.
Evidence - Socket Leak
A colleague pointed out that that tcp_mem might not be
containerized/namespace-ified, meaning it’s shared by the host and all
containers running on it. I started suspecting that some containers running on
the instance must be using a lot of TCP memory and possibly had a tcp memory leak.
To confirm this theory, I wrote the following script to export TCP memory usage on the instance every 10 seconds to a file.
#!/bin/bash
while true
do
  cat /proc/net/sockstat | grep TCP
  sleep 10
done
Then I went to enjoy dinner and entertainment. After a few hours, I drew a line chart using the data collected:
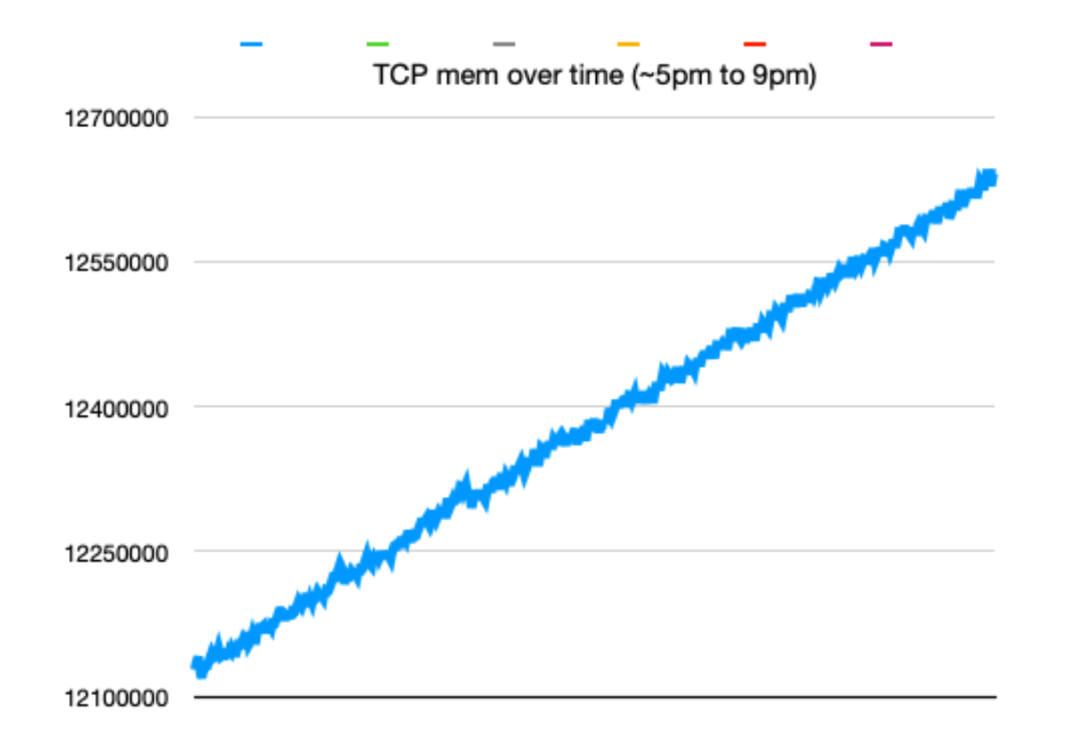
This chart strongly proved that there must be a memory leak, possibly socket leak somewhere on the instance.
Suspect #4 - A container
With the evidence above, I felt I was closer to the real culprit. I suspected
those containers running on the instance. But which one exactly? Though I was
able to see the TCP memory usage in /proc/net/sockstat, there is no breakdown
by process or even by TCP flow. And our friend ss (yeah, socket
statistics. NOT “The ss”)
could show the socket memory per TCP flow but can only get it in the current
network namespace and can’t sum them up. So, we need to build our own tool.
I wrote the following scripts to get skmem of all the docker containers on a
instance:
#!/bin/bash
containers=($(docker ps --format '{{.Names}}'))
for container in "${containers[@]}"
do
  echo "===$container==="
  pid=$(docker inspect --format '{{.State.Pid}}' "$container")
  sudo nsenter --target "$pid" --net -- ss -t -m | grep skmem | cut -d":" -f2 | tr -d "()"
done
It does the following:
- List all containers.
- For each container,
- Find its process ID.
- Enter the network namespace of the container using the process ID
- Run
ss -t -mcommand to getskmemof all TCP flows.
I ran the command and output to a file
$ ./query_skmem_in_containers.sh > skmem_all.txt
According to man ss(8), the output format of each socket is
              skmem:(r<rmem_alloc>,rb<rcv_buf>,t<wmem_alloc>,tb<snd_buf>,
                            f<fwd_alloc>,w<wmem_queued>,o<opt_mem>,
                            bl<back_log>,d<sock_drop>)
And from the description of each field, we could know that, for each socket,
socket_memory = <rmem_alloc> +
                <wmem_alloc> +
                <fwd_alloc> +
                <wmem_queued> +
                <opt_mem> +
                <back_log>
Basically, everything in the output excluding
<rcv_buf><snd_buf><sock_drop>
With this information, I wrote the following script to sum all skmem in each
container (Yeah I switched to Python because I’m really not good at bash):
with open('skmem_all.txt') as f:
    lines = [line.rstrip() for line in f]
    total = 0
    for line in lines:
        if line.startswith("==="):
            if total > 0:
                print(total)
            total = 0
            print(line)
            continue
        parts = line.split(",")
        for part in parts:
            if part.startswith("rb") or part.startswith("tb") or part.startswith("d"):
                continue
            elif part.startswith("bl"):
                total += int(part[2:])
            else:
                total += int(part[1:])
    print(total)
Running this script, we could get the sum of skmem by container.
$ python3 sum_skmem.py
===fd2ef688-e912-44a8-9005-76d739f063cb===
12288
===2d8d9356-d50a-43d3-a852-bf735af94fb2===
4096
===c38c0098-4296-4a62-a6e8-a11d04657965===
4096
===702a088a-8907-4efb-bd97-9db007416e36===
12288
===b9c0793f-f9e7-4c7f-a1ad-36ac341f45bd===
449998848
===bcd20bce-fab3-495e-9ba5-0e0700148919===
12288
===41576138-6db5-49d7-a1d0-3e41caecc645===
40960
===f54caa34-db7b-4c8a-834a-0ade8290c2e1===
8192
===2e8bb3ca-cec6-490d-ad48-eeb170cefb5f===
8794112
===1546347e-29ad-4686-9283-a6a2a7ac0948===
===5bdbf507-3258-4128-972d-4cd5c66dbd50===
===a9e43658-4e0f-45cd-b003-937277f31e15===
8192
===fe1863fe-4519-4841-ab20-b7eddf149d7e===
8192
===52f759c4-6e64-469e-a38b-e69a94dec96a===
===9e2ba64b-1528-41d0-8398-1160c558e513===
12288
===908fc5c4-25c0-4091-9964-ddad773b178b===
57344
===f1b012d6-3503-4d16-b123-0ba5c4016321===
===8a9df1c3-300f-4da0-ae86-9b5cc6377ced===
12288
===da7253e3-daaf-4138-a15d-0d8736076ae3===
12288
===3e7427f2-faaf-4f5f-add8-88bcf793c4b1===
12288
===9f97c1ed-ae8f-4309-94cf-cdf39cf8311d===
4096
===933d6619-25a5-456c-b4fa-79f5ef88c636===
14732496896
===be9da484-7d58-408d-94b5-430189d9c19f===
36864
Now we could see at least 2 very suspicious containers:
- b9c0793f-f9e7-4c7f-a1ad-36ac341f45bd
- 449998848 total skmem
- 933d6619-25a5-456c-b4fa-79f5ef88c636
- 14732496896 total skmem (Crazy! It’s 14 GB!)
Interestingly, these two containers ran the same workload.
I Need More Confidence
To be more sure that it was indeed a socket leak (After all, Metatron was wronged by me not long before), I ran another script to count all open sockets in all processes.
for d in /proc/*/; do
        sudo echo "==="$d"==="
        sudo ls -l $d/fd | grep -c socket
done
$ ./get_sockets.sh > sockets.txt
With this script, I found that one process had 4000+ open sockets:
$ cat socket.txt | grep -v === | sort -nr | head
4797
1167
946
566
280
261
255
170
92
92
And it belongs to process 4134187 (foo-health), which, according to
systemd-cgls command, also belongs to the same container
933d6619-25a5-456c-b4fa-79f5ef88c636.
Culprit Found! - foo-health Process
With the 2 strong pieces of evidence above, we could just say that foo-health
was the culprit we had been looking for. Yet Detective Hechao still felt bad
about the incorrect Metatron conviction before and wanted more assurance.
So, I went to the applications Spinnaker and Jenkins pages to find more clues. And the following interesting things caught my attention:
- The app was recently deployed on 9/16. And this issue started on 9/17.
- The app’s latest Jenkins build showed one change with title “Added
healthcheck for mTLS endpoint”.
- The word “healthcheck” immediately caught my attention because the
suspicious process is called
foo-health. - Looking at the commit, I found a file named
foo_health.gobeing changed. Really suspicious, isn’t it?
- The word “healthcheck” immediately caught my attention because the
suspicious process is called
Thankfully, the commit was not big. The code was in Golang. I took a cursory look and found that a newly added pieice of code like the following:
req, err := http.NewRequest("GET", fmt.Sprintf("https://%s:%s/", address, port), nil)
if err != nil {
	return errors.Wrap(err, "error creating request")
}
resp, err := client.Do(req)
if err != nil {
	return errors.Wrap(err, "error sending request")
}
return nil
Looks like it makes an HTTP request but doesn’t close the HTTP response body. According to this Go doc,
If the returned error is nil, the Response will contain a non-nil Body which the user is expected to close.
At this point, I could finally say that the case is cracked!
Fix
The immediate fix was of course asking the container owner to fix the leak. In
addition to that, we should also consider limiting the TCP memory per container
so that one bad container won’t affect the entire host. Unfortunately,
tcp_mem is not containerized and thus can’t be limited per container. But we
could consider limiting the open fds (ulimit -n) for the containers.