Use bpftrace for debugging - An example
Introduction
bpftrace is a high-level tracing language for Linux enhanced Berkeley Packet Filter (eBPF). I found it very useful for debugging issues as well as understanding kernel code. In this post, I will use one example to demonstrate how I used bpftrace for debugging.
Example - Unexpected DSCP modification
In one test, I found packets coming out of one process were marked with DSCP 18 unexpectedly. I needed to identify the culprit and bpftrace helped a lot.
Who sets DSCP?
There are at least two possibilities:
- A BPF program attached to egress TC hookpoint modifies DSCP.
- The process itself calls
setsockopto set DSCP.
I ruled out (1) by running command tc filter show dev eth0 egress to confirm there was no egress TC BPF programs. To confirm (2), I used bpftrace to check if there is any call to setsockop in the process. The following command means, “Trace all setsockopt syscalls in process 131204 and print the caller’s thread name and tid”.
1
# bpftrace -e 'tracepoint:syscalls:sys_enter_setsockopt /pid == 131204/ { printf("%s (tid %d)\n", comm, tid); }'
Note: comm, pid and tid are builtin variables. Though bpftrace README says comm is the process name, it is in fact the thread name.
Output of above tracing command confirmed that there were indeed setsockopt calls from this process. And all of them came from certain network-related library. This partially confirmed hypothesis (2). We still con’t be 100% sure because setsockopt can be used to set various options other than DSCP.
More evidence
To obtain more evidence, we need to confirm that setsockopt was called to set DSCP instead of other options. So let’s do a more detailed tracing:
1
2
3
4
5
6
7
8
9
10
11
12
13
14
15
# cat setsockopt.bt
tracepoint:syscalls:sys_enter_setsockopt
/pid==$1/
{
  @fd = args->fd;
  @level = args->level;
  @optname = args->optname;
  @optval = *args->optval;
  @optlen = args->optlen;
  if (@optname == 67) {
    printf("pid: %d, fd:%ld, level:'%ld', optname:%ld, val:%ld, len:%ld\n",
            pid, @fd, @level, @optname, @optval, @optlen);
    printf("%s\n", ustack());
  }
}
Here, instead of using a one-liner to trace callers, I wrote a more complex tracing script, which prints all parameters as well as user stack trace when setsockopt is called with optname parameter being 67 (IPV6_TCLASS).
When running bpftrace with this tracing script, I got something like
1
2
3
4
5
6
7
8
9
10
11
12
13
14
15
16
17
18
19
20
21
22
23
24
25
26
27
28
29
30
31
32
33
34
35
36
37
# bpftrace setsockopt.bt 131204
Attaching 1 probe...
pid: 131204, fd:26629, level:'41', optname:67, val:72, len:4

        0x7f46b035b2ea
        0x4ef7f57
        0x219056c
        0x218ffcc
        0x219b8d6
        0x21805a4
        0x218e63d
        0x219a50e
        0x218d66d
        0x218c465
        0x216d954
        0x216d954
        0x216d954
        0x2192f6c
        0x2196b12
        0x217f1d5
        0x2197b3a
        0x213ba03
        0x87a4769
        0x87a4f49
        0x87a4f1c
        0x12e3bc0
        0x12e3998
        0x12e37c8
        0x12dd412
        0x12f4a1e
        0x9d4ad75
        0x9d4ba5c
        0x9d4c79a
        0x87a2f6c
        0x7f46b1bb6680
        0x7f46b0c786b6
        0x7f46b0359ebf
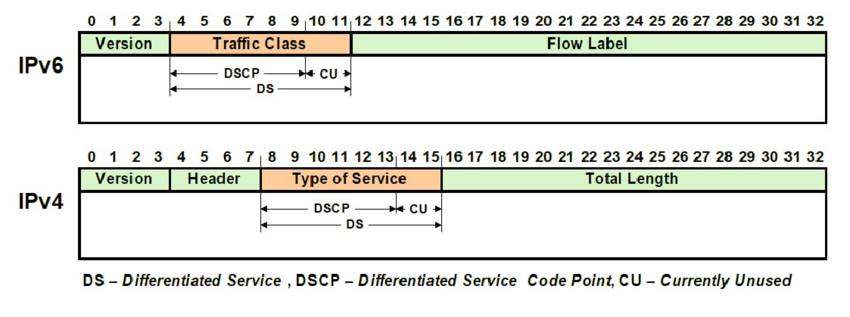
The val parameter has value 72. If we look at Traffic Class field in IPv6 header, 72 actually means DSCP 18 (18 << 2 == 72)!
Note: Unfortunately, the user stack printed by bpftrace only showed addresses but not symbols (See this issue). I had to attach gdb to the process to print the symbols.
1
2
3
# gdb -p 131204
(gdb) info symbol 0x7f46b035b2ea
...
After this tedious job (info symbol <addr> address by address), I eventually identified the stack trace in the library that sets DSCP.

Comments powered by Disqus.